
The noise, and the number
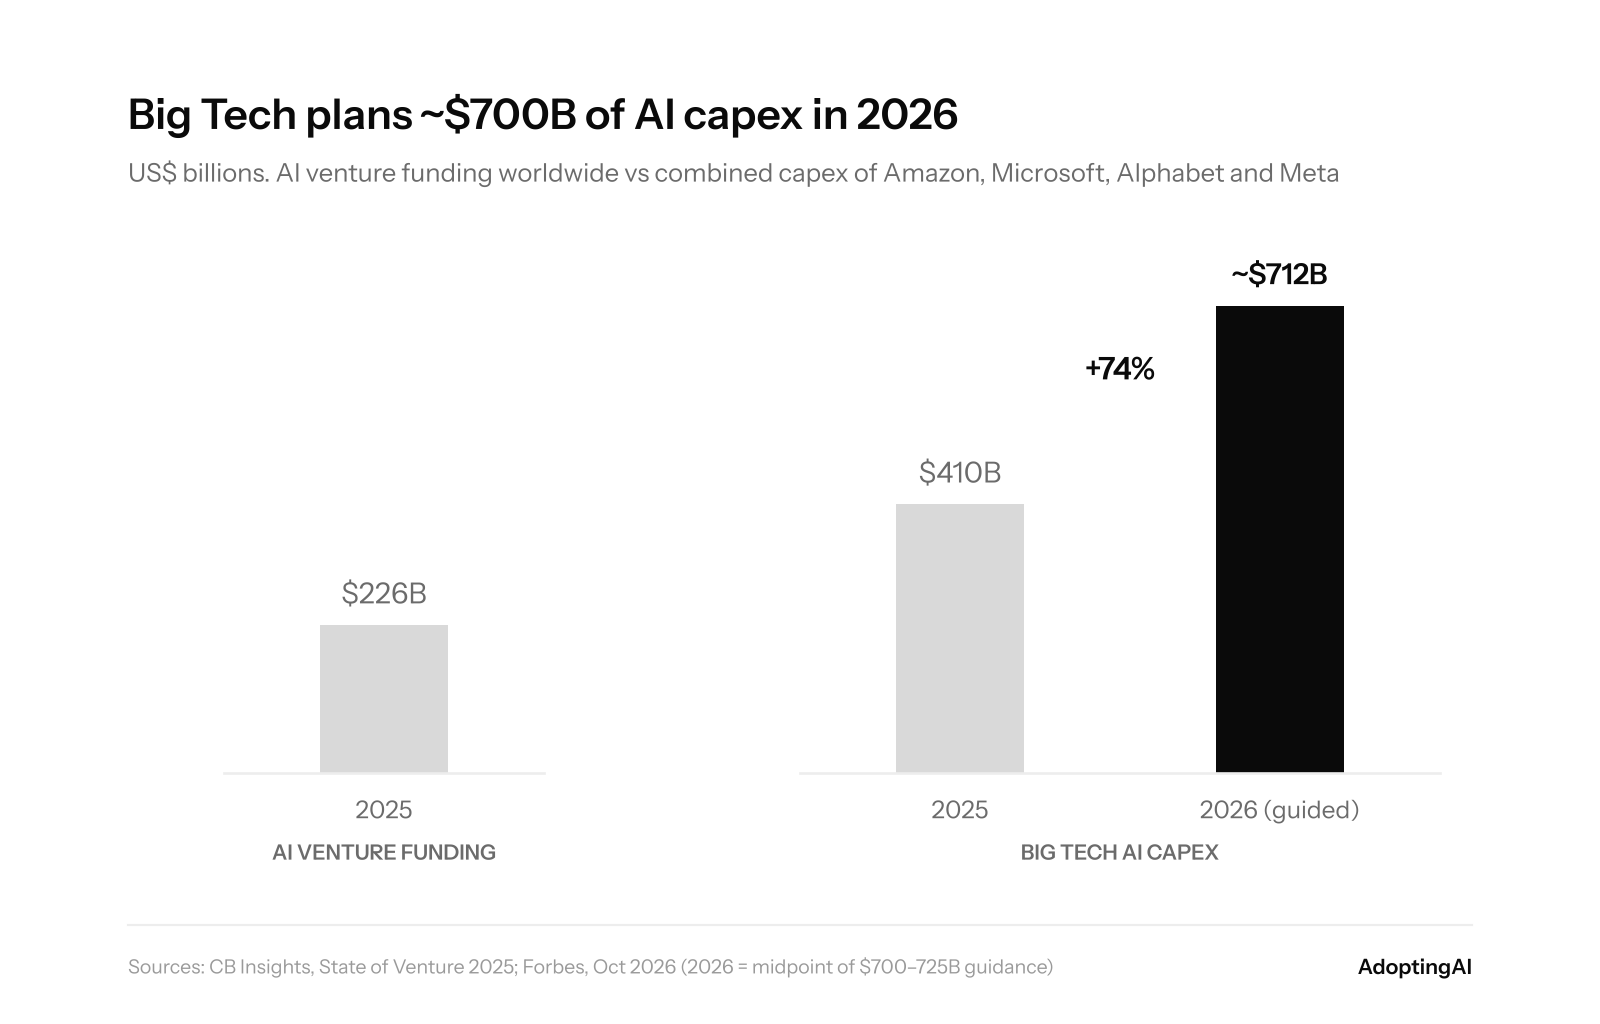
This year, four companies plan to spend roughly $700 billion building AI infrastructure. Last year, AI companies raised $226 billion, nearly half of all venture capital on Earth. Every week brings a new model, a new agent, a new launch event.
Now here's the number nobody puts on the keynote slide. About one in five businesses actually uses AI. One in five, in the United States and in Europe. And of the companies that do use it, roughly one in twenty can show it moving the bottom line in a big way.
That gap, between what is announced and what is adopted, is the most important story in technology right now. It's also the least covered. So we're going to cover it.
This is AdoptingAI, a research publication from PanScience. Not news. Not launches. Not funding rounds. Just one question, asked carefully, in every issue: where is AI actually working, in which industries, and why?
Let's start with the evidence.
The money is moving at the speed of light
The capital is real, and it is accelerating. AI companies raised $226 billion in 2025, 48% of all venture funding worldwide, according to CB Insights. The six largest rounds of the year all went to AI companies, led by OpenAI ($41 billion) and Anthropic ($32.5 billion).
Big Tech is spending even faster. Amazon, Microsoft, Alphabet and Meta plan to spend $700–725 billion on capex in 2026, up about 75% from a record $410 billion in 2025, Forbes reports.
Some revenue is showing up. Microsoft's AI business passed a $37 billion annual run rate, more than double a year earlier. Google Cloud's backlog is above $460 billion. But that is revenue for the people selling AI. The harder question is what the people buying it are getting back.
Even the builders are careful about this. Sam Altman told reporters in August 2025 that "investors as a whole are overexcited about AI" (Fortune). Satya Nadella set the bar higher still on Dwarkesh Patel's podcast: "The real benchmark is: the world growing at 10%." That benchmark is set by the people buying AI, not the people selling it.
The reality: one in five
Go to the official statistics, not the vendor decks. In Europe, 20% of enterprises used AI in 2025, up from 13.5% in 2024 and 8% in 2023. In the United States, the Census Bureau measured 19.8% in May 2026.
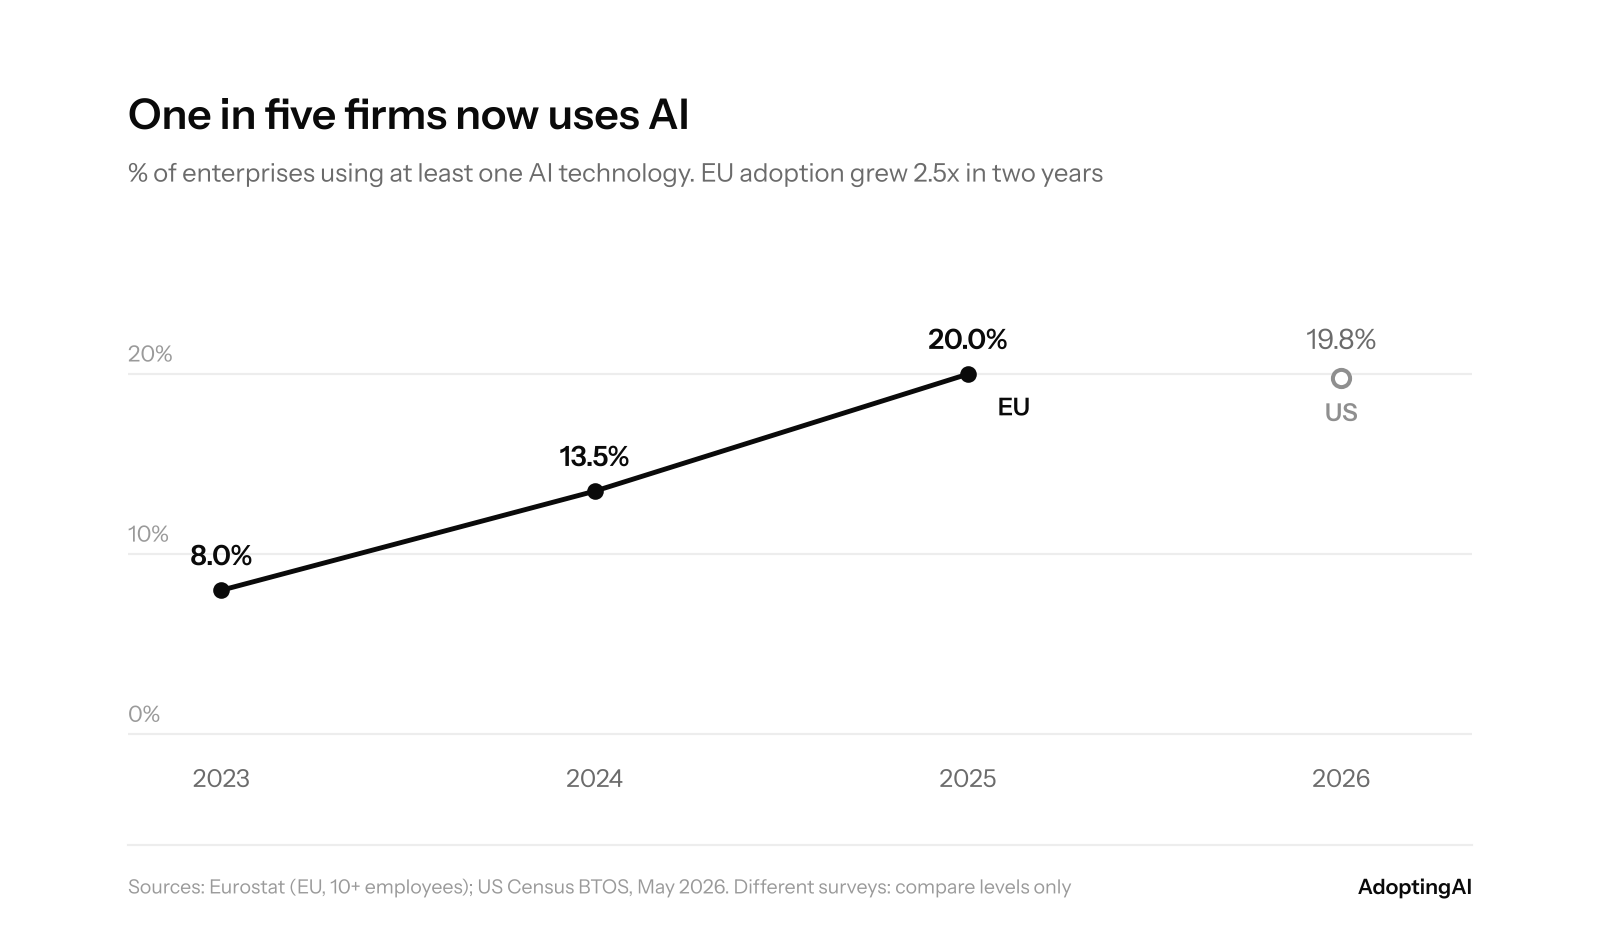
The growth is real. Adoption in Europe more than doubled in two years. But the level is still low, and it is not spread evenly. Size decides a lot.
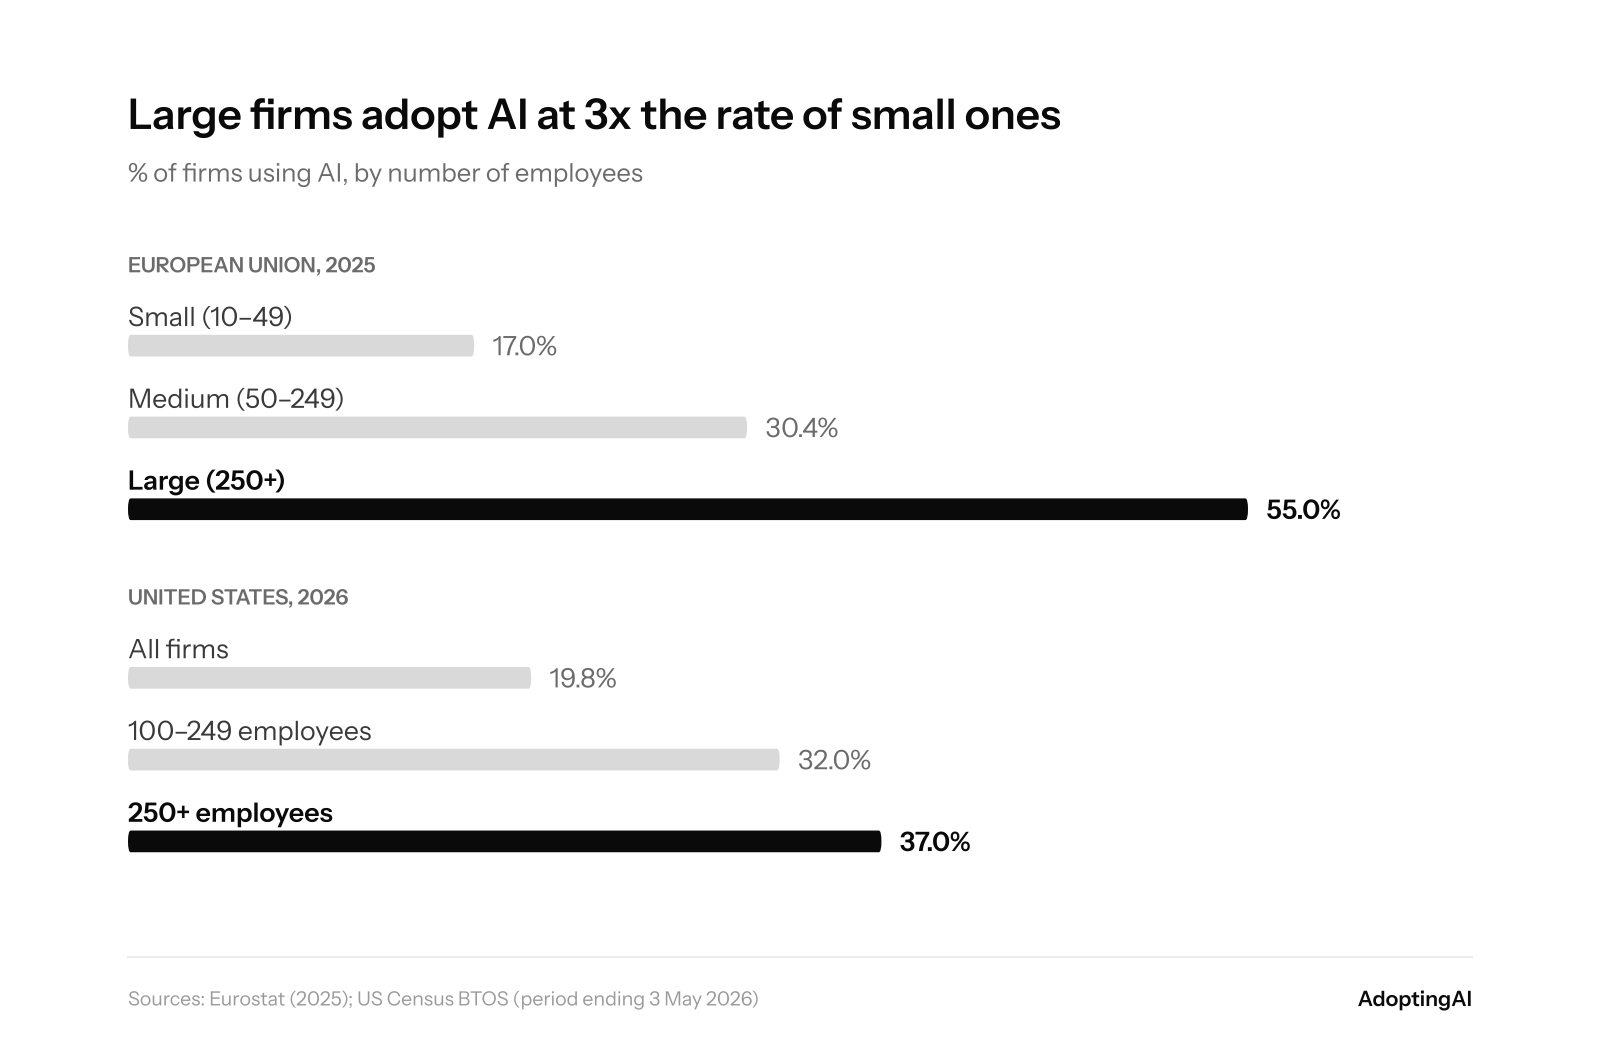
Think about what that means. A large company has data teams, cloud contracts and a procurement office. A small company has an owner who is also the IT department. AI is moving through the economy from the top down, and most of the economy sits at the bottom.
One caution on the US number. In November 2025, Census widened its question from AI used "in producing goods or services" to AI used "in any business function." So part of the recent jump is a new definition, not new adoption. We will flag changes like this every time. Most AI statistics don't.
Pilots are easy. Production is hard.
Using AI is one thing. Running a business on it is another. That's where the curve bends.
MIT's Project NANDA studied enterprise generative AI in 2025 and found that 95% of company generative AI pilots are falling short (Fortune). In its report, 60% of organizations evaluated custom enterprise tools, 20% piloted them and just 5% reached production. McKinsey's 2026 global survey tells the same story from the value side.
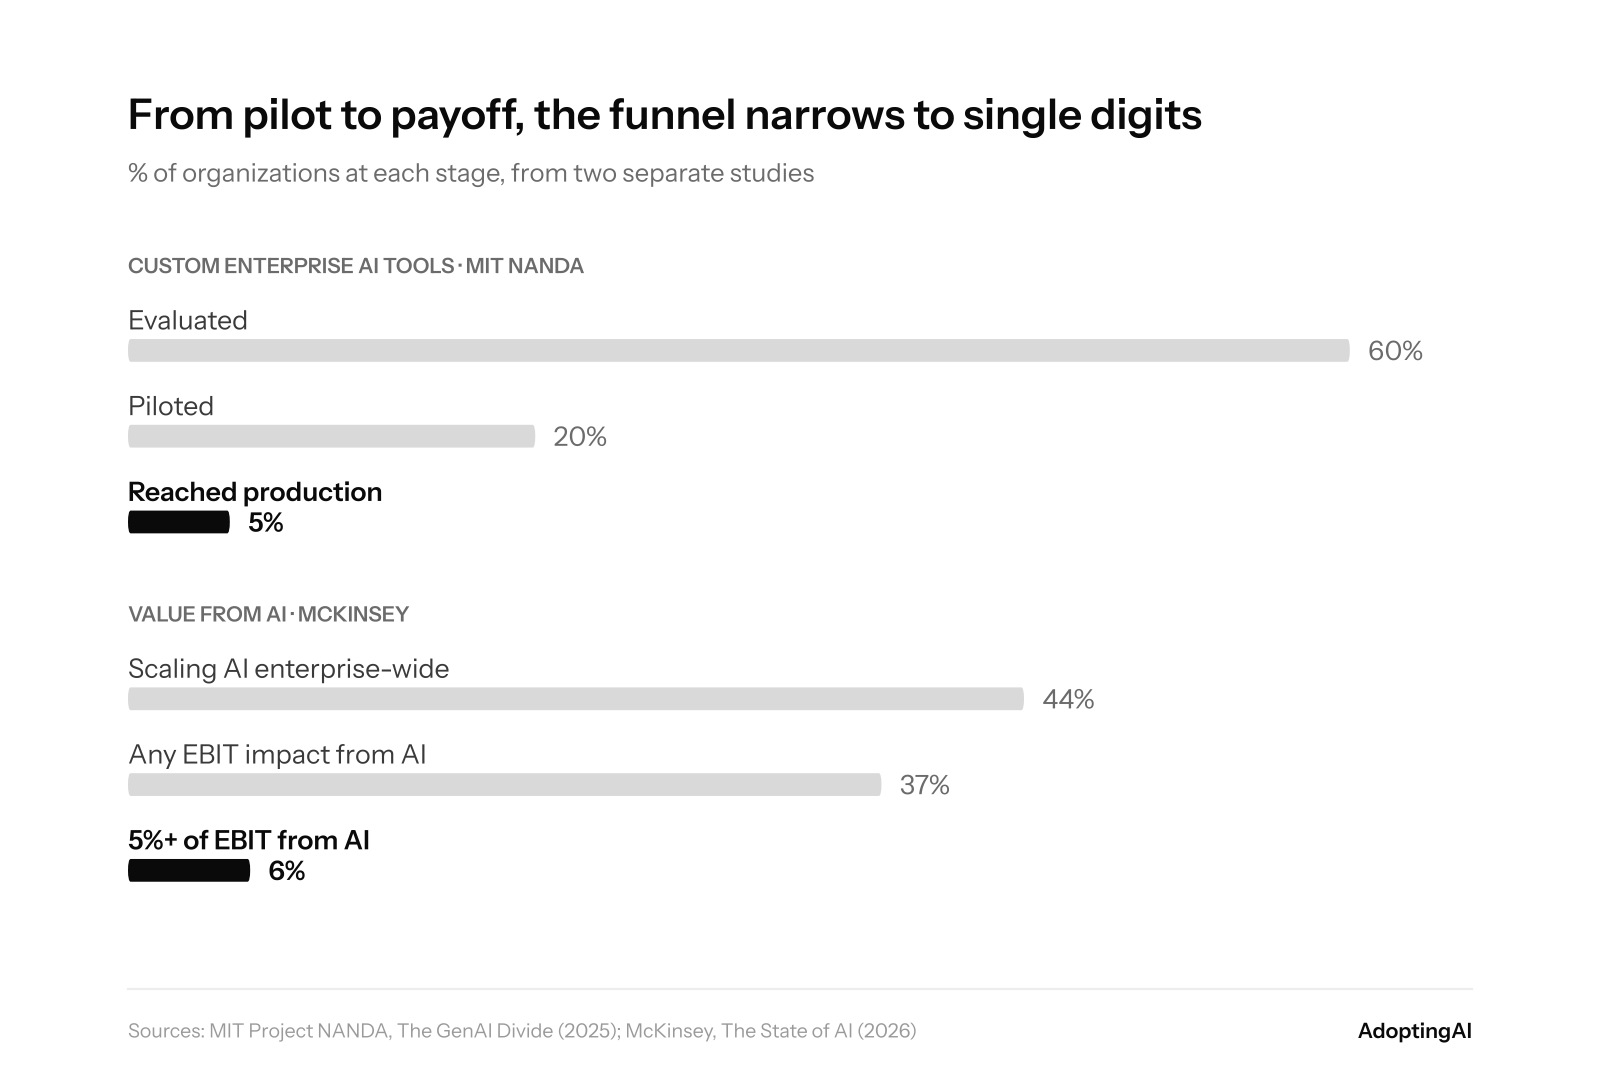
Read the McKinsey numbers slowly. Scaling rose from 38% to 44% in a year. EBIT impact did not move: 37%, flat. The high performers, the ones getting at least 5% of EBIT from AI, are still about 6%. So more companies are deploying AI, but the share making real money from it is not growing.
What do that 6% do differently? Nearly three-quarters of them have fundamentally redesigned their workflows. Only about a quarter of everyone else has. They didn't add AI to the old process. They rebuilt the process.
The warning lights are on for the next wave too. Gartner expects over 40% of agentic AI projects to be cancelled by the end of 2027, citing cost, unclear value and weak risk controls. Its analyst Anushree Verma put it bluntly: "Most agentic AI propositions lack significant value or return on investment." Gartner estimates only about 130 of the thousands of vendors claiming agentic AI are the real thing.
Industry by industry: two clear patterns
AI adoption is not one curve. It is many curves, and they depend on what an industry is made of. Where the work is already digital, AI moves fast. Where the work is physical, regulated or human-facing, it moves slowly.
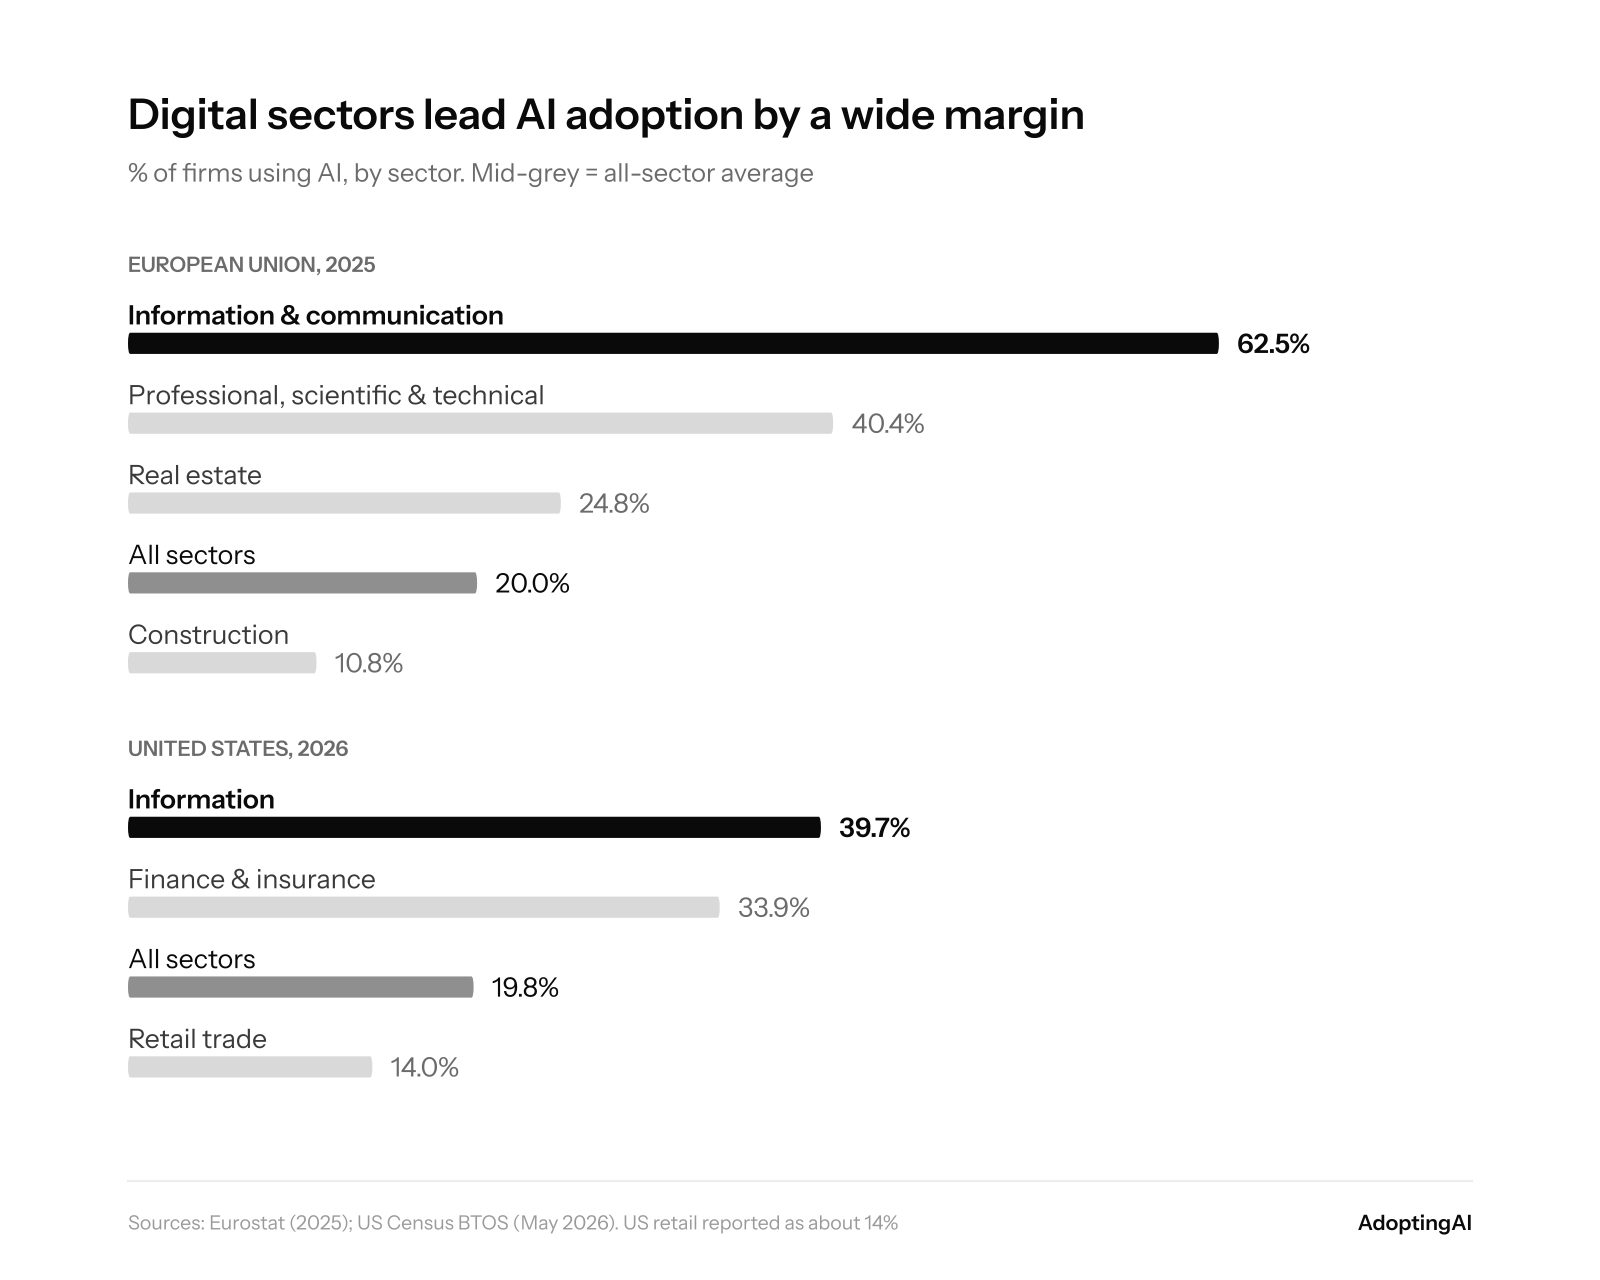
The second pattern is more surprising. Inside almost every industry, everyday AI use runs far ahead of deep adoption.
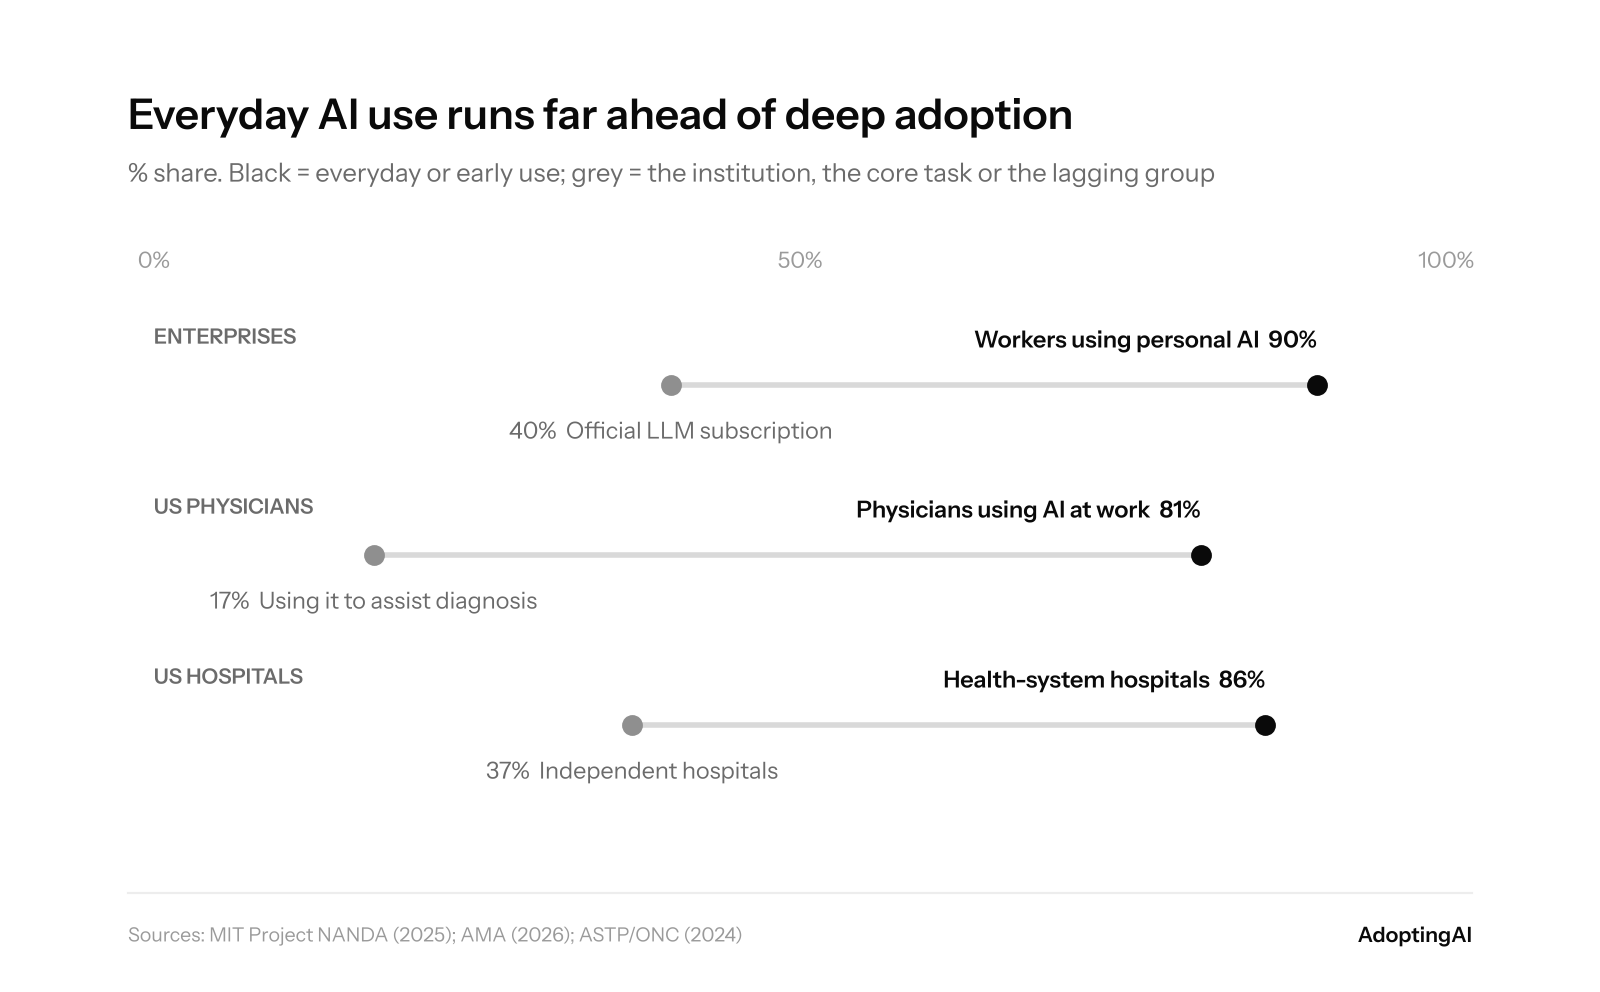
Here is what that looks like on the ground.
- Healthcare. 81% of US physicians now use AI, more than double 2023. But the top uses are paperwork: summarising research, writing discharge notes, coding charts. Only 17% use it to help with diagnosis. Among hospitals, 86% of system-affiliated ones use predictive AI, against 37% of independents. Scale buys adoption.
- Law. 79% of legal professionals have adopted AI to some extent, according to Clio's research reported by Law360. Clio estimates 74% of hourly legal work could be automated, which puts the billable hour itself under pressure.
- Financial services. Finance and insurance is the second-highest adopter in the US at 33.9%. It has the data, the budgets and the compliance teams to make AI stick.
- Manufacturing. European manufacturers sit below the all-sector average, and they mostly use AI for administration, marketing and accounting. Production processes and logistics lag. AI is entering the factory through the back office, not the shop floor.
See the thread? Across hospitals, law firms and factories, AI arrives first where it is cheap and low-risk: documents, emails, summaries. The core of the business, the diagnosis, the judgment, the production line, comes last. That is where the real value is, and where the real work is.
India and the world: geography is destiny, for now
Adoption depends on where you are, not just what you do. Inside the EU, the spread is enormous.
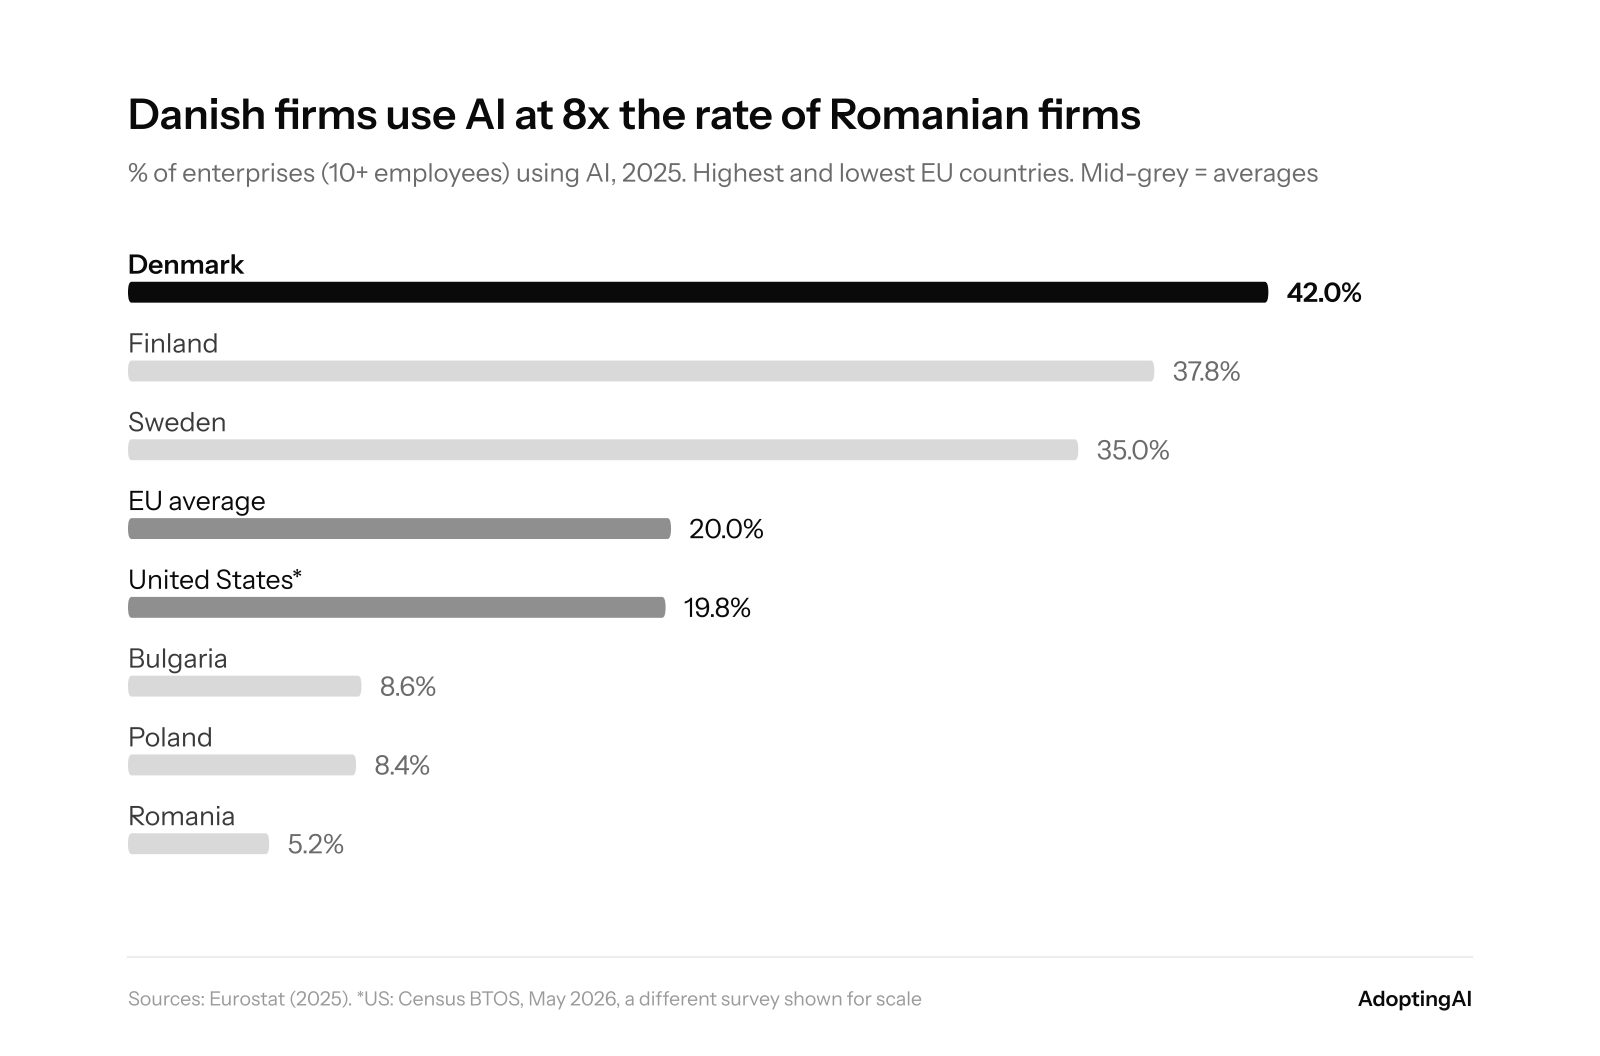
Denmark added 14.5 percentage points in a single year. The Nordic lead is not about better models. Everyone has access to the same models. It is about digital public infrastructure, skills and institutions that already run on data.
India is harder to read, and we'll be honest about why. There is no official, nationally representative measure of business AI use like Eurostat's or the US Census Bureau's.
The best large-sample view comes from EY and CII's November 2025 survey of 200 organizations. 47% have multiple generative AI use cases in production, and 23% are still piloting. That sample leans towards large organizations, so the broad base of Indian business is very likely further behind.
Spending is still cautious too. Over 95% of the organizations EY surveyed give AI less than 20% of their IT budget.
What stops adoption looks remarkably similar everywhere. It isn't doubt about the technology.
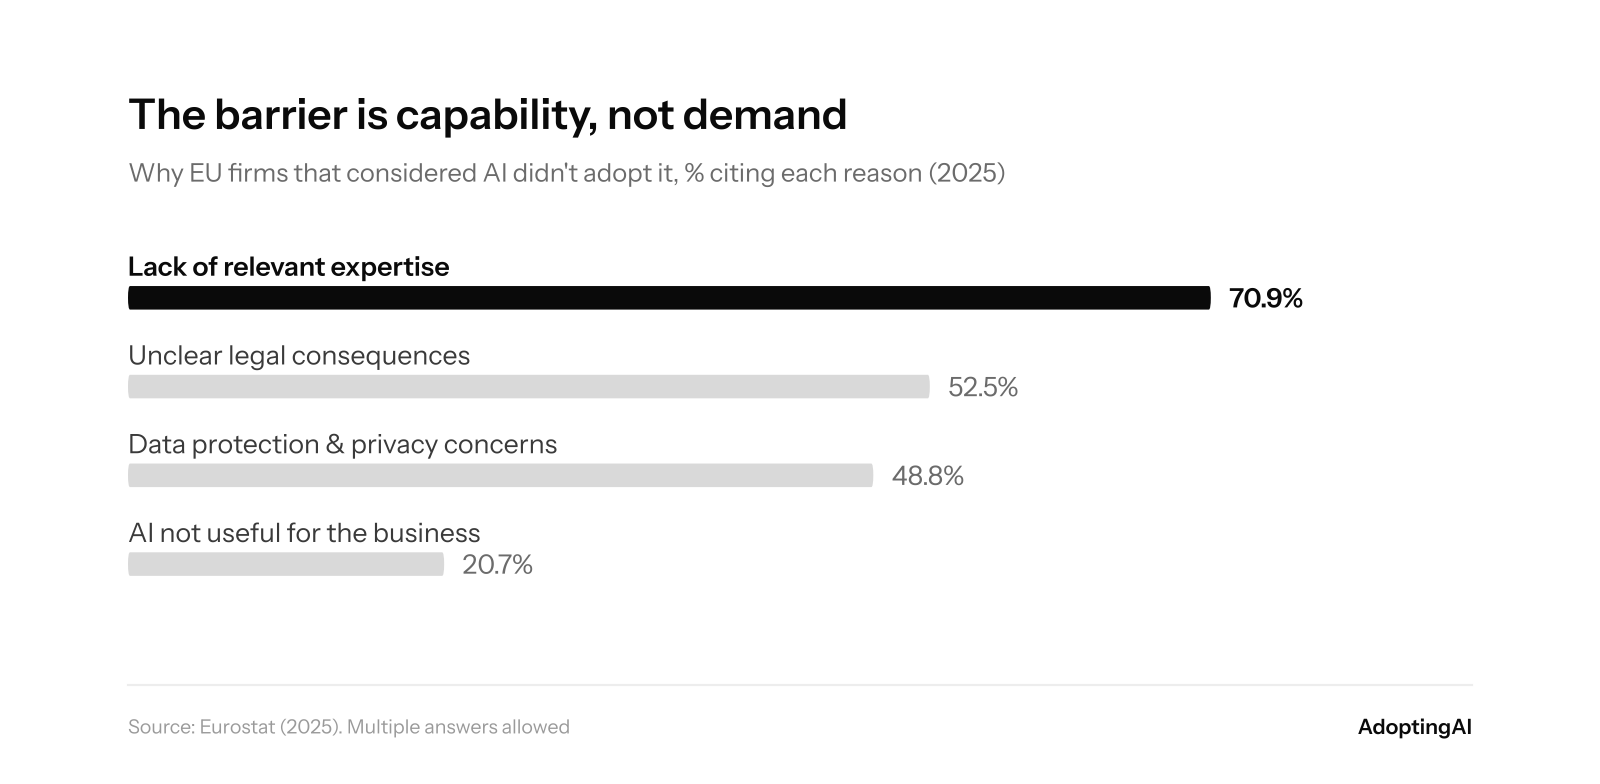
In India, 59% of leaders in the EY–CII survey cite a shortage of AI talent. Different country, same answer. The constraint is no longer the model. It is the institution around it.
Why we're doing this
PanScience is an AI venture studio based in India. We build companies with hospitals, courts, factories, banks, media houses and government. That gives us an unusual view. We see the same AI arrive in very different institutions, and we see it succeed in one and stall in another.
Most AI coverage looks at the technology. We want to look at the institution. Why does a hospital adopt AI for paperwork but not for diagnosis? Why does a law firm's staff use AI before the firm has a policy? Why does Denmark move at 8x the speed of Romania with the same models? Those are the questions that decide who gets the value.
Every issue will belong to one of five recurring series:
| Series | The question it answers |
|---|---|
| The Adoption Gap | Why some AI use cases reach production and most don't |
| Inside the Industry | How AI is really changing one sector, from the inside |
| The Economics of Intelligence | What AI costs, what it returns, and when it pays back |
| Cross-Industry Signals | What one industry can learn from another's mistakes |
| The Deployment Reality | What happens when AI meets legacy systems, rules and people |
And we're making a few promises. Every number will have a source you can check. We'll separate what is measured from what is estimated. We'll cover failures as seriously as successes. And when a story touches a PanScience venture, we'll say so.
One more thing. Starting with the next issue, we're building the Adoption Ledger: a running, sourced record of AI across industries, sorted into five stages. Announced. Piloting. In production. Organization-wide. Mission-critical. Most of the industry counts announcements. We're going to count what actually ships.
The real race
Here's what the data says, in one line. The technology is ready faster than the institutions are.
The winners of this decade won't be the companies with the best model. Everyone will have a good model. They'll be the hospitals, courts, factories and banks that redesign how their work gets done, and do it first. That race has barely started. One in five is not the finish line. It's the starting gun.
We'll be watching it, closely, with the numbers. Subscribe, and tell us which industry you want us to open up first.
Methodology note: Adoption figures come from different surveys with different samples and questions. We compare them for direction and scale, not as a single index. Ratios and growth rates are computed directly from the cited figures.
Sources
- CB Insights: State of Venture 2025
- Forbes: Big Tech will spend over $700 billion on AI this year (Oct 2026)
- US Census Bureau: AI use by businesses (May 2026)
- Eurostat: Use of artificial intelligence in enterprises (2025)
- Eurostat: 8% of EU enterprises used AI in 2023
- McKinsey: The State of AI (2026 survey)
- Fortune: MIT report finds 95% of generative AI pilots at companies are failing (Aug 2025)
- Gartner: Over 40% of agentic AI projects will be cancelled by end of 2027
- American Medical Association: More than 80% of physicians use AI (2026)
- ASTP/ONC: Hospital trends in predictive AI, 2023–2024
- Law360: Most legal professionals say they have adopted some AI
- Czech National Bank: AI in European firms
- EY–CII: India's AI shift from pilots to performance (Nov 2025)
- Fortune: Sam Altman on AI investor excitement (Aug 2025)
- Dwarkesh Podcast: Satya Nadella interview (Feb 2025)